Could Miami’s “delisting wave” hit Bahía de Banderas & Puerto Vallarta? Local market signals for 2025
If you’ve been watching U.S. real estate, Miami is the poster child for stubborn sellers. In July data, Miami posted 59 delistings for every 100 new listings, the longest time on market at 88 days, and prices down 4.7% year over year and 17.8% vs. 2022—classic signs of owners who’d rather retreat than negotiate. Media | Move, Inc.
So: can that happen in Bahía de Banderas and Puerto Vallarta (PV)? The short answer: the mechanics differ in three important ways—tourism resilience, short-term rental (STR) income, and a cash-heavy purchase structure—so the path looks more like a gradual rebalancing than a Miami-style standoff.
Table of Contents
Toggle1) Tourism demand is still a sturdy floor
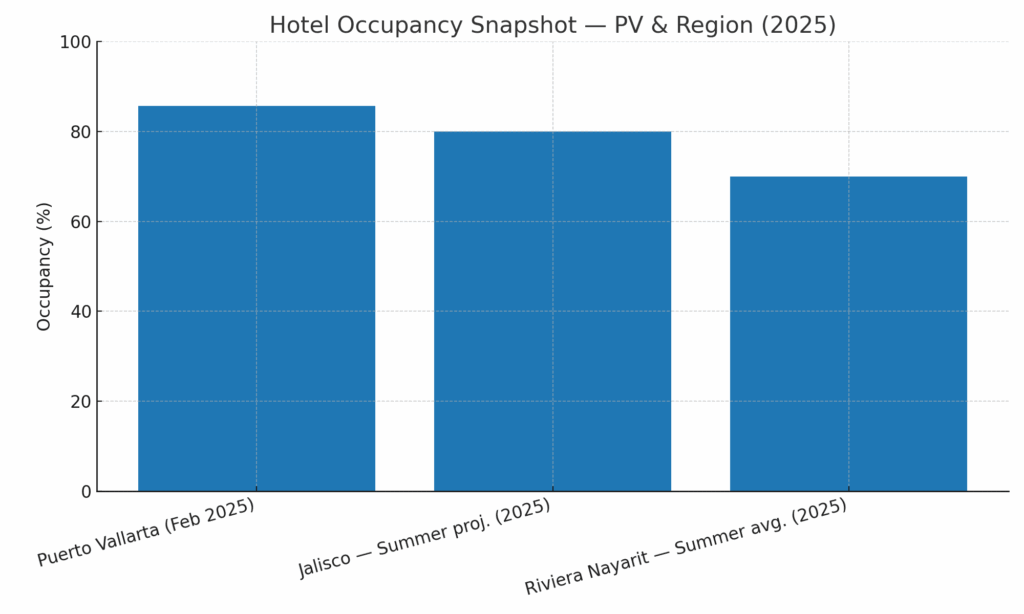
PV consistently ranks among Mexico’s top occupancy destinations. In February 2025, Puerto Vallarta registered 85.6% hotel occupancy in the federal DataTur snapshot—a level that would make many beach markets jealous. datatur.sectur.gob.mx
For the summer run-rate, local officials projected ~80% average occupancy for Puerto Vallarta, which aligns with July commentary from the municipal tourism office. Quadratin Jalisco Meanwhile next door, Riviera Nayarit hotels averaged around 70% over summer, according to regional press and hotel association remarks, with some outlets noting a “mediocre” season vs. prior years but still solid weekend highs. Puerto Vallarta Newsaznoticias.mx
Tourism isn’t the whole market—but it props up two crucial demand pillars: vacation rentals and second-home use. That matters when transaction pace slows, because owners have a viable “Plan B” (rent), rather than capitulating on price after a few stale weeks.

2) STR income softens the cycle
On the income side, sector analytics show median occupancy around 60% and **an average daily rate (ADR) near MXN 1,921 for PV-area listings, translating to ~MXN 398,000 average annual revenue (gross). Airbtics | Airbnb Analytics+1
Even if we haircut those figures for fees, cleaning, and platform commissions, a meaningful slice of owners can bridge slow sale windows with rental cash flow, rather than rushing to discount. Importantly, STRs in PV are highly seasonal; optimizing calendars, minimum stays, and rate strategy between high season (winter/spring) and shoulder periods is where operators preserve yield.
3) Purchase structure = less forced selling
PV/Bahía de Banderas sees a high share of all-cash or low-leverage buys, including foreigner purchases via fideicomiso (bank trust) in Mexico’s restricted zone. This structure lowers sensitivity to mortgage-rate spikes and reduces distressed supply. Mexico’s foreign-ownership process is well-worn: permits are issued through the Secretaría de Relaciones Exteriores (SRE), which publishes fees (e.g., the federal permit to constitute a trust) and timelines. sre.gob.mx+1
What the local residential data is saying
Local MLS roundups point to a mixed but stable picture: sales volumes up on a year-to-date basis in several segments, while inventory has grown, pushing absorption higher (i.e., slower). That’s the definition of a buyer-tilted market with more room to negotiate. For example, July 2025 MLS blogs show houses YTD sales up ~24% with absorption ~25 months, and condos with higher inventory and slower absorption even as prices vary by submarket. mexicolife.com+1
In simple terms: PV isn’t immune to longer marketing times—but owners are not boxed into the same corner as Miami because of tourism carry and less leverage.
Investor takeaways
Next 12–18 months: favor income over flips
Expect most of your return to come from rents (vacation or long-stay) rather than rapid price gains. Use conservative seasonality assumptions—lean into high-season occupancy and protect shoulder months with better minimum stays, mid-term rentals (30–90 days), or corporate/WFH demand. Airbtics | Airbnb Analytics
3-year view: 15–30% appreciation is plausible—if you buy right
On well-located, delivery-ready product, +15% to +30% by 2028 remains a reasonable band—provided you (a) buy competitively vs. comps, (b) avoid pre-sales execution risk unless the developer’s track record is bulletproof, and (c) actively optimize STR operations. This isn’t a promise of Miami-style snapbacks; it’s a workmanlike carry plus selective price growth.
Risks worth monitoring
Operating costs (HOA/condo fees, maintenance, electricity).
STR regulation (municipal updates, building-level bylaws).
FX (MXN–USD) exposure and international spend on travel.
Tourism cadence (federal and state occupancy trends show small YoY wiggles in 2025). datatur.sectur.gob.mx
Quick U.S. contrast: why PV ≠ Miami right now
Miami’s July snapshot—59 delistings per 100 new, 88 days on market, -4.7% YoY, -17.8% vs. 2022—is the combination of seller anchoring and inventory build colliding with buyers’ price discipline. It’s not a distressed story; it’s a “wait it out” story. But without a robust holiday-destination STR backstop (or with tougher local operating constraints), many sellers simply delist. Media | Move, Inc.
PV, by contrast, has tourism-supported income and cash-heavy ownership. As inventory rises, you get negotiation bandwidth—but fewer “yank the listing” episodes for lack of options.
Case study: “Tulipán PH” (developer-only example)
Price trajectory
Initial price (2022): MXN $2,703,000
Developer price (2025): MXN $5,341,415
Change since 2022: +97.7% total (≈ 25–26% CAGR 2022–2025)
2028 projection (base case, +30%): MXN $6,943,840
(Sensitivity: +15% → $6,142,627 | +45% → $7,745,052)
Rental scenarios (gross)
Long-term furnished
MXN $35,000/mo with +5%/yr escalator → MXN $1,324,050 over 3 years
Year-1 gross yield vs. developer price: ~7.86% (420,000 ÷ 5,341,415)
Long-term unfurnished
MXN $20,000/mo with +5%/yr → MXN $756,600 over 3 years
Year-1 gross yield vs. developer price: ~4.49% (240,000 ÷ 5,341,415)
Airbnb cap (illustrative)
Up to MXN $104,674/mo (actuals depend on ADR, occupancy, platform/cleaning fees, taxes).
All figures shown are gross. They exclude vacancies, management/commissions, cleanings, HOA/maintenance, utilities, and taxes. STR performance is seasonal and subject to building rules.
Actionable plan
Buy the discount, not the brochure. Target below-comp pricing or concessions (closing costs, furniture credits) in buildings with healthy HOA financials.
Underwrite STR prudently. Use ADR ≈ MXN 1,900–2,000 and occupancy ≈ 55–60% as a starting point, then flex by bedroom count and micro-location; revisit quarterly. Airbtics | Airbnb Analytics
Mind the paperwork. For foreign buyers, confirm fideicomiso timelines/costs (SRE permit + bank setup and annual fees). sre.gob.mx
Track local MLS cuts. Where absorption stretches, negotiate. July MLS reads indicate buyer leverage in several submarkets—great for value hunting. mexicolife.com
Portfolio hygiene. Re-price STRs monthly in high season, bi-weekly in peak weeks; expand mid-stay channels for shoulder months.
Sources (high-signal)
Miami snapshot (delistings, DOM, price change): Realtor.com Media Room July 31, 2025 (table shows Miami 59 delistings/100, 88 DOM, -4.7% YoY, -17.8% vs 2022). Media | Move, Inc.
Puerto Vallarta occupancy: DataTur, Feb 2025 report (PV 85.6%). datatur.sectur.gob.mx
Summer projections PV: Quadratín Jalisco (~80% summer). Quadratin Jalisco
Riviera Nayarit summer occupancy: PVDN / local press (~70%). Puerto Vallarta Newsaznoticias.mx
PV STR metrics: Airbtics (60% occupancy, ADR ≈ MXN 1,921; avg annual revenue ≈ MXN 397,923). Airbtics | Airbnb Analytics+1
Local MLS reads (PV): Mexico Life July 2025 market reports (sales up YTD; absorption higher). mexicolife.com+1
Fideicomiso costs/timelines: SRE fee schedule pages. sre.gob.mx+1

